

Chevron makes $18 billion a quarter in free cash. What did a SIP in Chevron actually do?
The news: Chevron has reshuffled its top team, reports Simply Wall St. A new chief financial officer, who comes from the company's New Energies arm, takes over in January 2027, and Chevron's directors are leaving the boards of Hess Midstream now that the Hess purchase has closed. The backdrop is a cash machine: US$18.1 billion of free cash flow in a recent quarter.
A company that throws off that much cash sounds like an easy hold. So we checked what a plain monthly SIP in Chevron actually did, against ExxonMobil and the S&P 500, over two windows: since October 2023, when Chevron announced the Hess deal, and over the last ten years.
What changed at Chevron
- A new CFO from January 2027, moving over from Chevron's New Energies business, so the person in charge of capital allocation knows both oil and lower-carbon projects.
- Hess Midstream: Chevron-affiliated directors are stepping off its boards following the purchase agreement closing.
- The cash: US$18.1 billion of free cash flow in a recent quarter, which funds the dividend, buybacks and debt reduction.
- The price: US$217.73, with analysts' consensus target of US$227.71 only 4.4% higher, Simply Wall St notes.
What a monthly SIP did, two windows
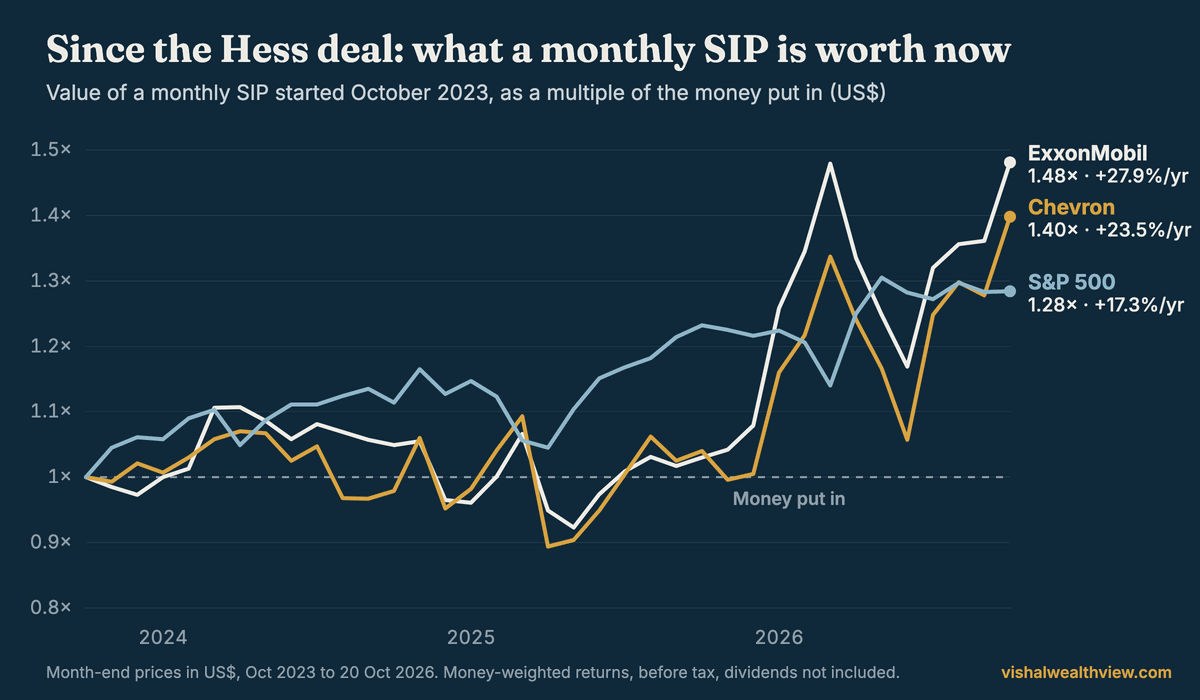
A fixed amount in US dollars invested at each month-end. Returns are money-weighted (XIRR) and before tax, without dividends.
| SIP, a year | Since Oct 2023 | 10 years | Worst fall, 10 yrs |
|---|---|---|---|
| Chevron | 23.52% | 11.14% | 45.0% |
| ExxonMobil | 27.87% | 15.44% | 63.9% |
| S&P 500 | 17.32% | 14.03% | 24.8% |
The ten-year window runs from October 2016 to 20 October 2026. All three are at all-time highs this month.
Since the Hess deal: Chevron beat the market
A SIP started in October 2023 has made 23.52% a year in Chevron, against 17.32% in the S&P 500. Every US$100 put in is now worth about US$140. The ride was not straight: in April 2025 the same SIP was worth US$89 per US$100 put in, before the climb to today's high.
Over ten years: it trailed the market
Stretch the window to ten years and the picture flips. Chevron's SIP made 11.14% a year, behind the S&P 500's 14.03%, and it fell 45% at its worst during the 2020 oil crash. ExxonMobil made more, 15.44% a year, but with a deeper 63.9% fall. Dividends, which oil majors pay generously, are not in these figures and would add a few points a year to both.
What to take from this
Strong cash flow tells you a company is healthy. It does not tell you what its shares will pay a monthly investor. The same stock gave 23.5% a year over three years and 11.1% over ten, depending only on when you started.
Before acting on a headline, check two things on real data: what your SIP would have made from your start date, and whether you could have held on through its worst fall. You can run Chevron, ExxonMobil and the S&P 500 in the Strategy Lab and change the start date in a second.
Questions people ask
What did Chevron announce?
Simply Wall St reports a reshuffle of Chevron's senior roles in October 2026, including a new chief financial officer from January 2027 who comes from the company's New Energies business, and the exit of Chevron-affiliated directors from Hess Midstream's boards.
How much free cash flow does Chevron make?
US$18.1 billion in a recent quarter, according to Simply Wall St. That cash funds Chevron's dividend, buybacks and debt reduction.
What has a monthly SIP in Chevron returned?
23.52% a year from October 2023, when the Hess deal was announced, to 20 October 2026, in US dollars and before tax. Over ten years from October 2016 it made 11.14% a year, with a 45% fall in the 2020 oil crash.
Did Chevron beat the S&P 500?
Since October 2023, yes: 23.52% a year against 17.32% for an S&P 500 SIP on the same dates. Over ten years, no: 11.14% against 14.03%.
Is Chevron undervalued?
We don't say. Simply Wall St notes the consensus analyst target of US$227.71 is 4.4% above the recent US$217.73 share price. Our figures describe what happened, not what will.
How we measured: month-end prices in US dollars (Yahoo Finance), a fixed amount invested every month, returns money-weighted (XIRR) and before tax. Dividends are not included. October 2026 uses the price on 20 October. "Worst fall" is the largest month-end drop in the SIP's value from a previous high inside the window. Source for the news: Simply Wall St. Past returns are not a promise of future returns. Nothing here is a recommendation to buy or sell anything. See the disclaimer.
← All posts