

The golden cross on a SIP: does a moving-average crossover pay?
A moving-average crossover compares two averages of the same index: a fast one and a slow one. When the fast average crosses above the slow one, the trend has turned up and you invest. When it crosses below, you move to a liquid fund. The famous pair is the 50-day and the 200-day: a golden cross when the 50 rises through the 200, a death cross when it falls through. We use the 2-month and 10-month averages of daily closes, checked at each month-end.
How it differs from a single moving average
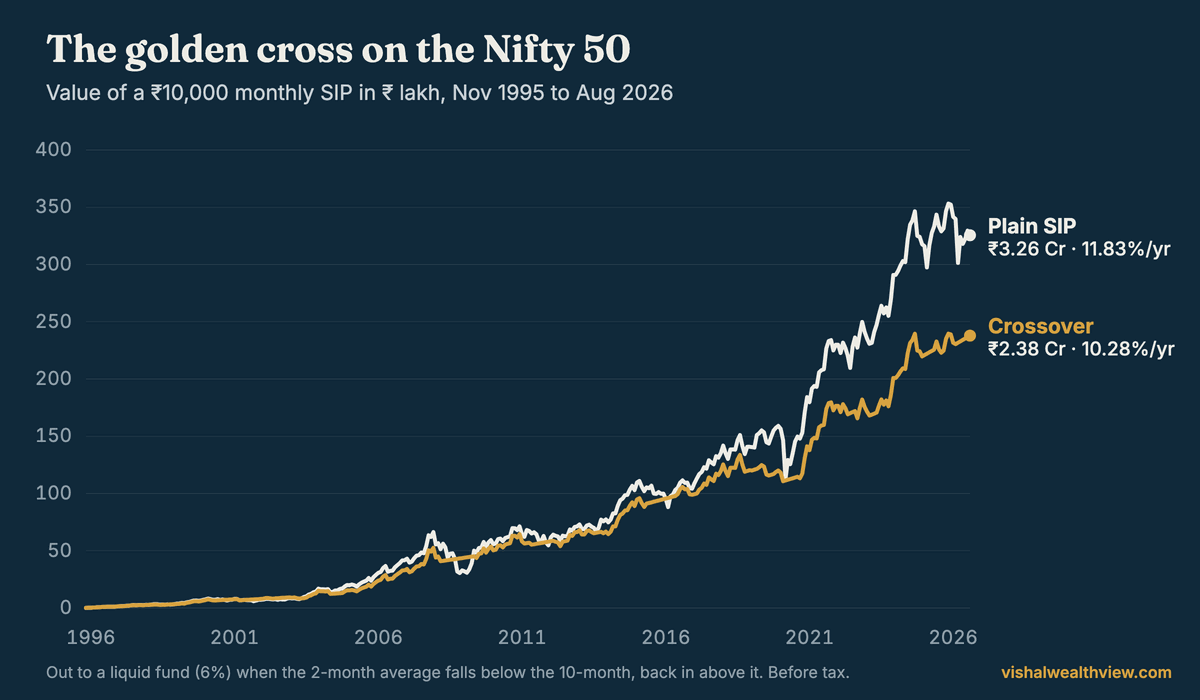
The moving-average rule reacts to the price itself crossing the average. A crossover waits for the fast average to cross, which smooths out one-month spikes. It trades less (21 exits on the Nifty 50 in 31 years, against 28 for the 10-month rule) and gets out later.
The result on three markets
| 2-month over 10-month, whole history | Plain SIP | With the rule | Exits | 10-year periods it won |
|---|---|---|---|---|
| Nifty 50, 1995–2026 | 11.83% | 9.13% | 21 | 20% |
| Midcap Momentum 50, 2005–2026 | 20.97% | 15.25% | 13 | 0% |
| S&P 500, 1985–2026 | 9.07% | 9.54% | 18 | 46% |
The S&P 500 is the one market where the golden cross came out ahead over the whole history, by under half a point a year, and even there it won fewer than half of the 10-year periods. On the Indian indices it lost: by 2.70 points a year on the Nifty 50 and 5.72 on Midcap Momentum 50, where it did not beat a plain SIP in a single 10-year period. It did cut the worst fall: from −55% to −36% on the Nifty 50, from −69% to −39% on Midcap Momentum 50 and from −53% to −25% on the S&P 500.
Other pairs
Changing the averages did not rescue it on Indian data. A 3-month over 12-month crossover made 10.63% on the Nifty 50 and a 5-month over 10-month 10.29%, both below the plain SIP’s 11.83%. On the S&P 500 both trailed plain investing too, at 8.57% and 8.35%.
After tax
With Indian capital-gains tax on both sides, the 2-over-10 crossover made 7.74% against 11.26% on the Nifty 50 and 13.44% against 20.06% on Midcap Momentum 50. Under US tax on the S&P 500 its small lead turned into a loss: 8.11% against 8.56%.
What to take from this
A crossover is a slower, calmer version of the moving-average rule. It fits markets with long trends, which the S&P 500 had more of than the Nifty in these periods. On our Indian data it cost 2.7 points a year on the Nifty 50 and 5.7 on Midcap Momentum 50 for a smaller worst fall. The golden cross in the news is a signal about the trend so far, not a forecast.
The moving-average rules are part of Strategy Lab Premium. The drawdown rule and the strategy search are free.
Investing in the US? The DCA backtest is the same Lab in dollar-cost-averaging terms, on the S&P 500 in dollars.
Questions people ask
What is a golden cross?
A golden cross is when a short-term moving average, usually the 50-day, rises above a long-term one, usually the 200-day. The opposite, the short average falling below the long one, is called a death cross.
Does the golden cross strategy work on the Nifty 50?
Not in our backtest. Investing only while the 2-month average was above the 10-month made 9.13% a year from 1995 to 2026, against 11.83% for a plain SIP, and came out ahead in 20% of 10-year periods.
Does the golden cross work on the S&P 500?
Barely, before tax: 9.54% a year from 1985 to 2026 against 9.07% for plain investing, with a much smaller worst fall. After US capital-gains tax it trailed, 8.11% against 8.56%.
Is a crossover better than a single moving average?
It trades less and reacts later. On the S&P 500 the crossover beat the 10-month rule (9.54% against 8.65%); on the Nifty 50 it did worse (9.13% against 11.45%). Both trailed a plain SIP in India.
Data: official month-end closes from NSE Indices for the Nifty 50 (Nov 1995 to Aug 2026) and Nifty Midcap150 Momentum 50 (Apr 2005 to Aug 2026); S&P 500 month-end closes from Yahoo Finance (Jan 1985 to Aug 2026). All are price indices, so dividends are left out of both sides. A fixed monthly amount is invested at each month-end. Money moved out earns 6% a year in a liquid fund in India and 4% in cash for the S&P 500. Returns are money-weighted (XIRR) and before tax unless a line says otherwise; the after-tax runs use the Strategy Lab’s Indian rules (12.5% long-term and 20% short-term gains, ₹1.25 lakh exemption, liquid-fund interest at a 30% slab) and, for the S&P 500, US rules (15% long-term, 24% short-term). Rolling periods start in every month. Figures come from the same engine the Strategy Lab runs in your browser. The rule moves 100% of the holding when the 2-month simple moving average closes below the 10-month one and buys back when it closes above, with no dead band; the SIP keeps investing throughout. An N-month average is the average of every daily close in the last N months, from NSE Indices’ official daily closes; for the S&P 500, the average of the last N month-end closes. Past returns are not a promise of future returns. Nothing here is a recommendation to buy or sell anything. See the disclaimer.
← All strategies