

The 200-day moving average rule: does it beat a plain SIP?
The moving-average rule is a trend-following rule. You stay invested while the index closes above its long-term average and move to a liquid fund when it closes below. The best-known version uses the 200-day moving average. On month-end data the usual stand-in is the 10-month average, the version Mebane Faber tested in his 2007 paper on tactical asset allocation. The monthly SIP keeps going in; the rule decides where the money you already have sits.
How the rule works
At each month-end, compare the index with the average of every daily close in the last 10 months. Below the average, move the holding to a liquid fund. Back above it, buy back in. Shorter averages react faster and trade more: 5 months stands in for the 100-day average, 2 for the 50-day. The Strategy Lab also lets you add a dead band, so a price sitting on its average does not flip every month, and a wait of a month or two to confirm the signal.
The result on three markets
| 10-month average, whole history | Plain SIP | With the rule | Months out | 10-year periods it won |
|---|---|---|---|---|
| Nifty 50, 1995–2026 | 11.83% | 11.45% | 31% | 35% |
| Midcap Momentum 50, 2005–2026 | 20.97% | 15.90% | 26% | 0.7% |
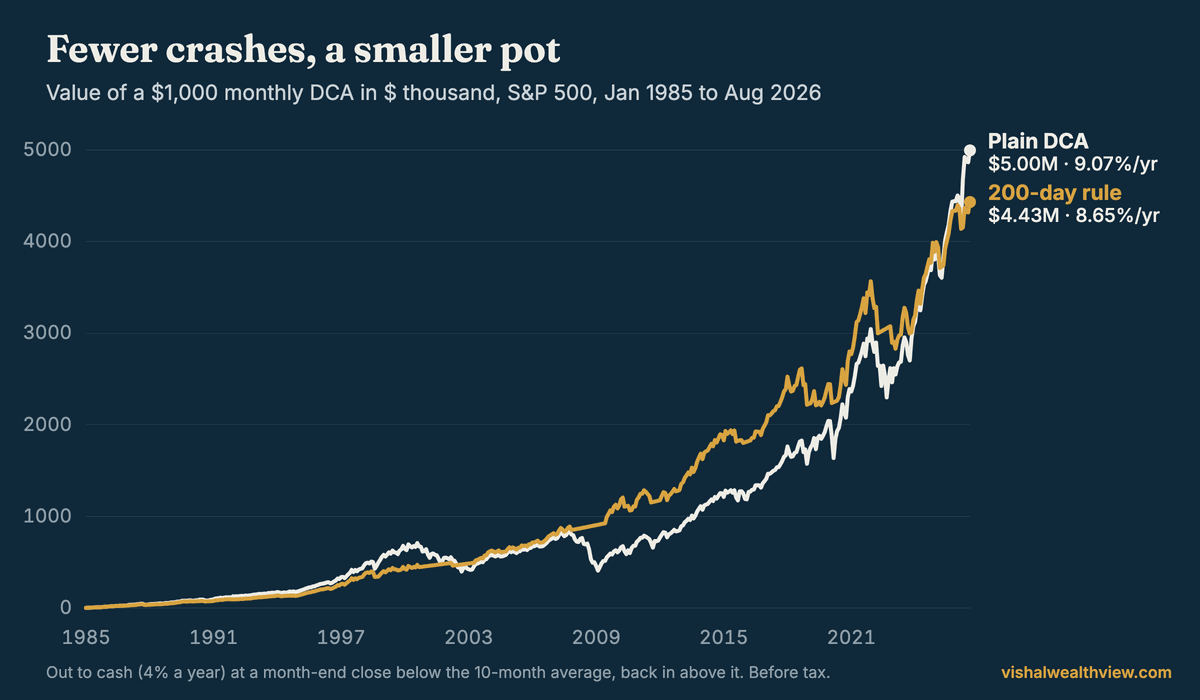
| S&P 500, 1985–2026 | 9.07% | 8.65% | 23% | 47% |
It lost on all three: by under half a point a year on the Nifty 50 and the S&P 500, and by 5.07 on Midcap Momentum 50. What it did every time was cut the worst fall: from −55% to −31% on the Nifty 50, from −69% to −39% on Midcap Momentum 50 and from −53% to −25% on the S&P 500.
The answer depends on when you stop counting
On the S&P 500 the rule stepped aside for most of the 2000–2002 fall and all of 2008, and was ahead of plain investing for 23 years, from July 2002 to May 2025. It lost the lead in two quick falls that recovered within weeks: it sold in March 2025 and bought back two months later 5% higher, then sold in March 2026 and bought back a month later 10% higher. A 10-month average cannot tell a correction from the start of a crash until afterwards.
On the Nifty 50, 21 of the rule’s 27 round trips since 1995 bought back at a higher level than they sold. It was ahead for most of 1998–2004 and from the 2008 crash until late 2018, and has trailed since mid-2020.
Shorter or longer averages
No length won everywhere. On the Nifty 50 the faster 5-month average beat a plain SIP by 1.63 points a year and came out ahead in 59% of 10-year periods, while the 12-month did worst (−1.66). On Midcap Momentum 50 the 5-month average also won over the whole history (+1.62 points) but beat a plain SIP in only 35% of 10-year periods. On the S&P 500 the 12-month average came out 0.09 points ahead over 41 years and behind in most 10-year stretches.
After tax
Every exit sells units, so tax makes the rule worse. With Indian capital-gains tax, the 10-month rule made 9.85% against 11.26% on the Nifty 50 and 13.91% against 20.06% on Midcap Momentum 50. Under US rules on the S&P 500, 7.25% against 8.56%.
What to take from this
The moving-average rule is a way to have a smaller worst year, not a higher return. On our data the 10-month rule cut the deepest fall by about half and cost between 0.4 and 5.1 points a year, more after tax. The faster 5-month average is the exception: it beat a plain SIP on both Indian indices over the whole history, though on Midcap Momentum 50 only in a minority of 10-year periods. If you would otherwise sell in a panic, a rule that sells early and on a schedule may still be the better trade. If you would hold through a crash, plain investing did better.
The moving-average rules are part of Strategy Lab Premium. The drawdown rule and the strategy search are free.
Investing in the US? The DCA backtest is the same Lab in dollar-cost-averaging terms, on the S&P 500 in dollars.
Questions people ask
What is the 200-day moving average rule?
Stay invested while the index is above its 200-day moving average and move to cash or a liquid fund when it closes below. On monthly data the 10-month moving average is the usual stand-in.
Does the 200-day moving average strategy work in India?
Mostly not, in its usual 10-month form. On the Nifty 50 from 1995 to 2026 the 10-month rule made 11.45% a year against 11.83% for a plain SIP, and beat it in 35% of 10-year periods. It did cut the worst fall, from 55% to 31%. The faster 5-month average did better: 13.46% a year, ahead in 59% of 10-year periods.
Does the 200-day moving average beat buy and hold on the S&P 500?
Almost, before tax. From 1985 to 2026 the 10-month rule made 8.65% a year against 9.07%, and it led for most of 2008 to 2020. It roughly halved the worst fall, from 53% to 25%. After US tax it made 7.25% against 8.56%.
Which moving average length is best?
None was best everywhere. The 5-month average did best on the Nifty 50 and Midcap Momentum 50, where it beat a plain SIP over the whole history, and the 12-month on the S&P 500. On Midcap Momentum 50 even the 5-month average lost in most 10-year periods.
What is the difference between a moving-average rule and a crossover?
A moving-average rule compares the price with one average. A crossover compares a fast average with a slow one, such as the 50-day with the 200-day, which reacts later but trades less.
Data: official month-end closes from NSE Indices for the Nifty 50 (Nov 1995 to Aug 2026) and Nifty Midcap150 Momentum 50 (Apr 2005 to Aug 2026); S&P 500 month-end closes from Yahoo Finance (Jan 1985 to Aug 2026). All are price indices, so dividends are left out of both sides. A fixed monthly amount is invested at each month-end. Money moved out earns 6% a year in a liquid fund in India and 4% in cash for the S&P 500. Returns are money-weighted (XIRR) and before tax unless a line says otherwise; the after-tax runs use the Strategy Lab’s Indian rules (12.5% long-term and 20% short-term gains, ₹1.25 lakh exemption, liquid-fund interest at a 30% slab) and, for the S&P 500, US rules (15% long-term, 24% short-term). Rolling periods start in every month. Figures come from the same engine the Strategy Lab runs in your browser. The rule moves 100% of the holding at a month-end close past a 10-month simple moving average, with no dead band and no confirmation wait; the SIP keeps investing throughout. An N-month average is the average of every daily close in the last N months, from NSE Indices’ official daily closes; for the S&P 500, the average of the last N month-end closes. Past returns are not a promise of future returns. Nothing here is a recommendation to buy or sell anything. See the disclaimer.
← All strategies