

Drawdown rule: sell after a fall, buy back lower. Does it beat a plain SIP?
A drawdown rule is a market-timing rule for a SIP. You keep investing every month, but when the index falls a set percentage from its highest point, you move part of your holding to a liquid fund. You buy back after a deeper fall, or once the market recovers to a level you chose in advance. It is the rule the Strategy Lab opens on.
We tested 31,080 versions of it on three markets: the Nifty 50 since 1995, Nifty Midcap Momentum 50 since 2005 and the S&P 500 since 1985. The best version won on every market, but only in hindsight.
How the rule works
Four settings define it:
- Sell trigger. How far the index must fall from its running peak before you act, for example 20%.
- Share moved. How much of the holding goes to the liquid fund: a quarter, half, three quarters or all of it. The monthly SIP keeps going into the index either way.
- Deep-crash buy-back. A deeper fall, for example 35%, at which everything goes back in.
- Recovery re-entry. If the crash never gets that deep, the money goes back once the fall has recovered to this level. 0% means waiting for a new high.
So “sell 100% at 17.5%, buy back at 42.5%, re-enter at 12.5%” means: when the index is 17.5% below its peak, move everything to the liquid fund; buy it all back if the fall reaches 42.5%, or once the index climbs back to 12.5% below its peak.
A month that closes past the buy-back line too still sells. The stop-limit rule holds there instead.
What we tested
Every combination of a sell trigger from 5% to 50%, a buy-back from 20% to 80% (at least 5 points deeper), four shares moved and a re-entry from 0% to 50%, all in 2.5% steps: 31,080 rules per market. Each rule ran on a ₹10,000 monthly SIP against the same SIP left alone.
| Best rule, whole history | Plain SIP | Best rule | Rules that beat plain | Deepest fall, rule vs plain |
|---|---|---|---|---|
| Nifty 50, 1995–2026 | 11.83% | 13.94% | 11.9% | −34% vs −55% |
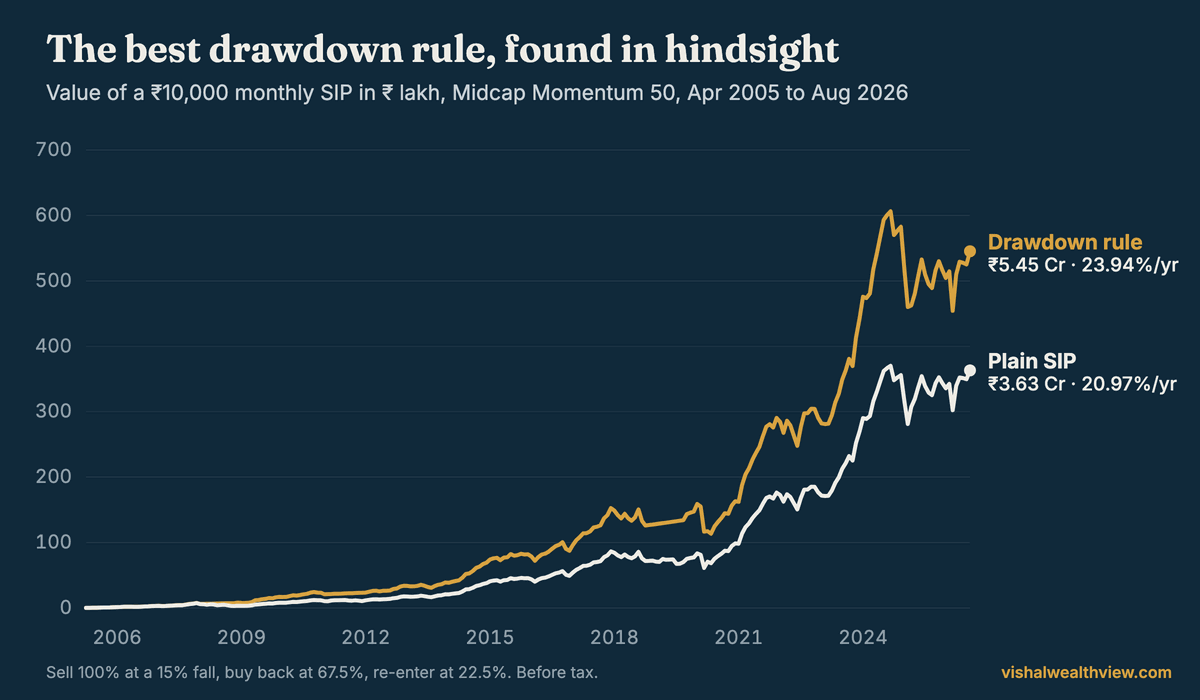
| Midcap Momentum 50, 2005–2026 | 20.97% | 23.94% | 20.5% | −29% vs −69% |
| S&P 500, 1985–2026 | 9.07% | 11.03% | 18.0% | −26% vs −53% |
The winning rules: sell 100% at a 30% fall on the Nifty 50 (buy back at 55%, re-enter at 42.5%); at 15% on Midcap Momentum 50 (buy back at 67.5%, re-enter at 22.5%); and at 17.5% on the S&P 500 (buy back at 42.5%, re-enter at 12.5%). Three markets, three very different rules.
The catch: you only know the best rule afterwards
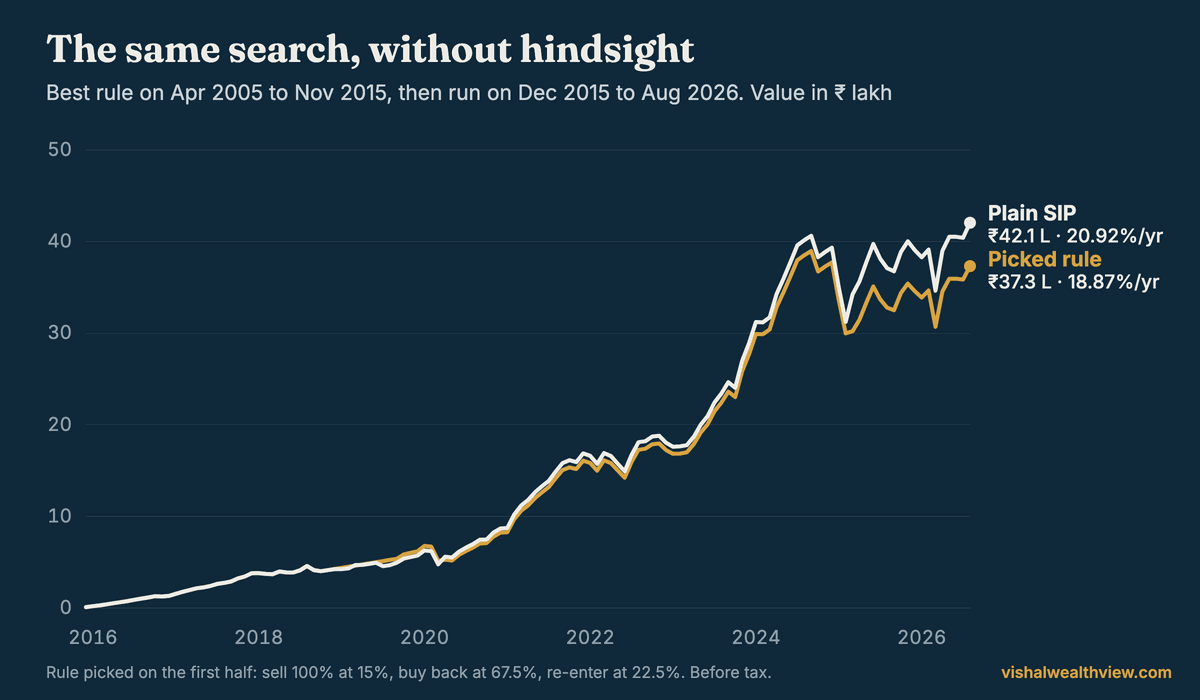
A rule picked on the same data it is scored on will always look good. So we split each history in half, found the best rule on the first half, and ran that rule on the second half, which it had never seen.
| Picked on the first half, run on the second | Run on | Picked rule | Plain SIP |
|---|---|---|---|
| Nifty 50 | Apr 2011–Aug 2026 | 4.80% | 10.65% |
| Midcap Momentum 50 | Dec 2015–Aug 2026 | 18.87% | 20.92% |
| S&P 500 | Nov 2005–Aug 2026 | 10.24% | 11.68% |
It lost on all three. On Midcap Momentum 50 the rule tuned to 2005–2015 sold at a 15% fall and waited for either a 67.5% crash or a recovery to 22.5% below the peak. That is the same rule that wins over the whole history, and all of its lead came from the first decade, where it beat a plain SIP by 10.2 points a year. In the second it sold three times, in October 2018, March 2020 and February 2025, and twice bought back higher: 15% higher a month after the March 2020 low and 9% higher in March 2025. It trailed the plain SIP by 2.05 points a year.
Does it hold up in most 10-year periods?
Running the best rule over every 10-year stretch inside each history, it beat a plain SIP in 70% of periods on the Nifty 50, only 38% on Midcap Momentum 50 and 62% on the S&P 500. That still flatters it, because the rule was chosen on the whole history. On Midcap Momentum 50 the whole-history winner trailed in most 10-year stretches: its lead is mostly one decade, the one with 2008 in it.
A rule chosen without looking, the round “sell 70% at a 20% fall, buy back at 35%”, did worse: −3.35 points a year on the Nifty 50, −1.37 on Midcap Momentum 50 and −0.72 on the S&P 500.
After tax
Every switch sells units, and selling is taxed. With Indian capital-gains tax on both sides, the best rules still led: 12.94% against 11.26% on the Nifty 50 and 21.68% against 20.06% on Midcap Momentum 50. On the S&P 500 under US rules, 9.85% against 8.56%. Tax narrows the gap; it does not change which rules won in hindsight.
What to take from this
The one thing the drawdown rule did reliably was cut the deepest fall: roughly half as deep as a plain SIP on all three markets. If a smaller crash is what keeps you investing, that is worth something. As a way to earn more, it depends on picking the right thresholds before the market shows you which ones those were, and history says that is hard.
Try it on your own fund or index. The Strategy Lab runs the same 31,080-rule search in your browser, and the Rolling windows tab shows how often a rule wins.
Investing in the US? The DCA backtest is the same Lab in dollar-cost-averaging terms, on the S&P 500 in dollars.
Questions people ask
What is a drawdown rule in a SIP?
A drawdown rule keeps a monthly SIP running but moves part of the holding to a liquid fund when the index falls a set percentage from its peak, then buys back after a deeper fall or once the market recovers to a chosen level.
Does a drawdown rule beat a plain SIP?
Only in hindsight. The best of 31,080 rules beat a plain SIP on the Nifty 50, Midcap Momentum 50 and the S&P 500, but only 12% to 20% of the rules did, and the best rule picked on the first half of each history lost to a plain SIP on the second half in all three markets.
What is the best sell trigger for a drawdown rule?
It differs by market and by period. The best rule sold at a 30% fall on the Nifty 50 since 1995, at 15% on Midcap Momentum 50 since 2005 and at 17.5% on the S&P 500 since 1985. None of those would have been the best on a different period.
Is a drawdown rule the same as buying the dip?
No. A drawdown rule sells part of your holding after a fall and buys it back later. A buy-the-dip SIP never sells: it only adds extra money while the market is below its peak.
Does tax wipe out the drawdown rule’s gains?
Not for the best rules in our test. With Indian capital-gains tax on both sides, the best rule made 12.94% a year against 11.26% on the Nifty 50, and 21.68% against 20.06% on Midcap Momentum 50. Tax narrows the edge but does not erase it.
Data: official month-end closes from NSE Indices for the Nifty 50 (Nov 1995 to Aug 2026) and Nifty Midcap150 Momentum 50 (Apr 2005 to Aug 2026); S&P 500 month-end closes from Yahoo Finance (Jan 1985 to Aug 2026). All are price indices, so dividends are left out of both sides. A fixed monthly amount is invested at each month-end. Money moved out earns 6% a year in a liquid fund in India and 4% in cash for the S&P 500. Returns are money-weighted (XIRR) and before tax unless a line says otherwise; the after-tax runs use the Strategy Lab’s Indian rules (12.5% long-term and 20% short-term gains, ₹1.25 lakh exemption, liquid-fund interest at a 30% slab) and, for the S&P 500, US rules (15% long-term, 24% short-term). Rolling periods start in every month. Figures come from the same engine the Strategy Lab runs in your browser. The search grid matches the Lab’s “Find the best strategy”: sell 5–50%, buy-back 20–80% and at least 5 points deeper, share moved 25/50/75/100%, re-entry 0–50%, 2.5% steps. The first-half test splits each history at its midpoint. Past returns are not a promise of future returns. Nothing here is a recommendation to buy or sell anything. See the disclaimer.
← All strategies