

Stop-limit rule: sell after a fall, hold through a sudden crash
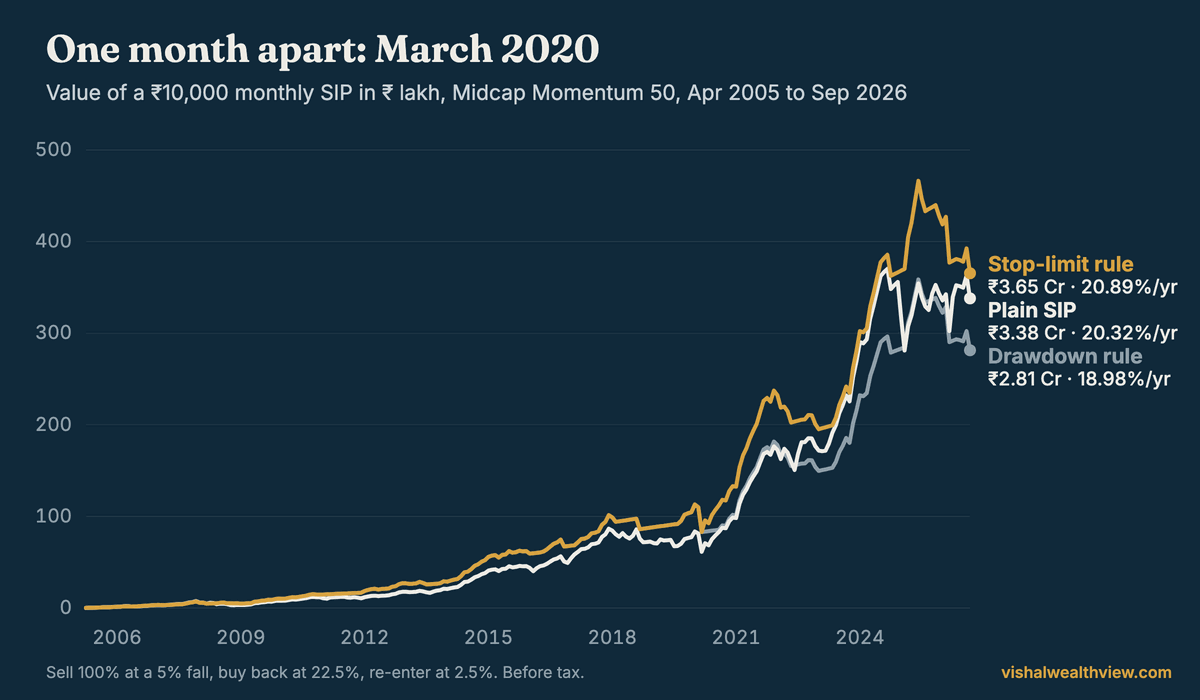
The stop-limit rule is the drawdown rule with one change: a month that closes past the crash buy-back line too holds instead of selling. Selling there would only buy straight back.
Midcap Momentum 50, Apr 2005 to Sep 2026, ₹10,000 a month. Sell at 5%, buy back at 22.5%, re-enter at 2.5%. Before tax.
The rule
- Sell line, 5%. A month-end close this far below the peak moves the holding to a liquid fund.
- Crash line, 22.5%. A close this far below buys everything back.
- Re-entry, 2.5%. Or buy back once the fall recovers to this level.
- Hold. A close past both lines at once does not sell. The next fall is measured from that close.
| Midcap Momentum 50 | Stop-limit | Drawdown | Plain SIP |
|---|---|---|---|
| Before tax | 20.89% | 18.98% | 20.32% |
| After tax | 18.13% | 16.35% | 19.43% |
| Worst fall | −47% | −47% | −69% |
| Sells / holds | 21 / 1 | 22 / 0 | – |
Where it held
| Same lines | Held | Fall | Drawdown rule bought back | Stop-limit vs drawdown |
|---|---|---|---|---|
| Midcap Momentum 50 | Mar 2020 | 26.7% | Aug 2020, 34% higher | 20.89% vs 18.98% |
| Nifty 50 | Oct 2008 | 26.4% | Nov 2008, 4.5% lower | 9.94% vs 10.14% |
| S&P 500 | Oct 1987 | 23.7% | Nov 1987, 8.5% lower | 7.00% vs 7.10% |
One month each. A rebound followed March 2020; deeper falls followed October 2008 and October 1987.
Across 31,080 settings
| 31,080 settings | Held | Stop-limit ahead | Drawdown ahead | Best of each, hindsight |
|---|---|---|---|---|
| Midcap Momentum 50 | 3,404 | 2,209 | 1,195 | 24.24% vs 23.62% |
| Nifty 50 | 3,720 | 1,104 | 2,616 | 13.61% vs 13.59% |
| S&P 500 | 1,380 | 376 | 1,004 | 11.03% vs 11.03% |
The other settings never closed past both lines in one month, so the two rules matched.
Investing in the US? The DCA backtest is the same Lab in dollar-cost-averaging terms, on the S&P 500 in dollars.
Questions people ask
What is the stop-limit rule?
A SIP timing rule: sell after a set fall from the peak, buy back at a deeper crash line or on a recovery, but hold when a month-end close is already past the crash line too.
How is it different from the drawdown rule?
Only in a month that closes past both lines at once. The drawdown rule sells there; the stop-limit rule holds and measures the next fall from that close. Every other month is the same.
Does the stop-limit rule beat the drawdown rule?
It depends on what followed the crash month. Of the 31,080 settings in the Lab’s search, it came out ahead in 2,209 and behind in 1,195 on Midcap Momentum 50, ahead in 1,104 and behind in 2,616 on the Nifty 50, and ahead in 376 and behind in 1,004 on the S&P 500. In the rest the two rules matched.
Why is it called stop-limit?
After the stop-limit order: a sell order that triggers at a stop price but does not fill past a limit price. Here the sell line is the stop and the crash buy-back line is the limit.
Data: official month-end closes from NSE Indices for the Nifty 50 (Nov 1995 to Sep 2026) and Nifty Midcap150 Momentum 50 (Apr 2005 to Sep 2026); S&P 500 month-end closes from Yahoo Finance (Jan 1985 to Aug 2026). All are price indices, so dividends are left out of both sides. A fixed amount is invested at each month-end. Money moved out earns 6% a year in a liquid fund in India and 4% in cash for the S&P 500. Returns are money-weighted (XIRR) and before tax unless a line says otherwise; the after-tax line uses the Strategy Lab’s Indian rules (12.5% long-term and 20% short-term gains, ₹1.25 lakh exemption, liquid-fund interest at a 30% slab). The search grid matches the Lab’s “Find the best strategy”: sell 5–50%, buy-back 20–80% and at least 5 points deeper, share moved 25/50/75/100%, re-entry 0–50%, 2.5% steps. Figures come from the same engine the Strategy Lab runs in your browser. Past returns are not a promise of future returns. Nothing here is a recommendation to buy or sell anything. See the disclaimer.
← All strategies