

Buy-the-dip SIP: does putting in more during falls pay?
A buy-the-dip SIP keeps your regular SIP going and adds extra money whenever the index is down from its peak. It never sells. The version we tested puts in 1.5 times the SIP when the index is 10% below its peak, twice the SIP at 20% below and three times at 30% below. It is the Strategy Lab’s “Buy the dip” SIP type.
Unlike a drawdown rule, which sells after a fall, a buy-the-dip SIP is a way to time extra money. So the fair comparison is not only against the plain SIP, but against the same total money spread evenly every month.
The result on three markets
| Whole history | Plain SIP | Buy the dip | Put in (dip vs plain) | Dip vs same money evenly |
|---|---|---|---|---|
| Nifty 50, 1995–2026 | 11.83% | 12.26% | ₹51.4 L vs ₹37.0 L | +23.4% |
| Midcap Momentum 50, 2005–2026 | 20.97% | 21.42% | ₹36.4 L vs ₹25.7 L | +22.3% |
| S&P 500, 1985–2026 | 9.07% | 9.18% | $664k vs $500k | −2.2% |
Per rupee, the dip SIP beat a plain SIP on all three markets, and in almost every 10-year period: 243 of 251 on the Nifty 50, 136 of 138 on Midcap Momentum 50 and 324 of 381 on the S&P 500. The edge per rupee is small, under half a point a year.
The bigger question is whether timing the extra money beat simply investing it evenly from the start. On the two Indian indices it did, by a wide margin: the same total money grew 23.4% more on the Nifty 50 and 22.3% more on Midcap Momentum 50. On the S&P 500 it did not. Spreading the money evenly ended 2.2% ahead, because the S&P 500 spent long stretches near its highs, when the dip SIP was only putting in the base amount.
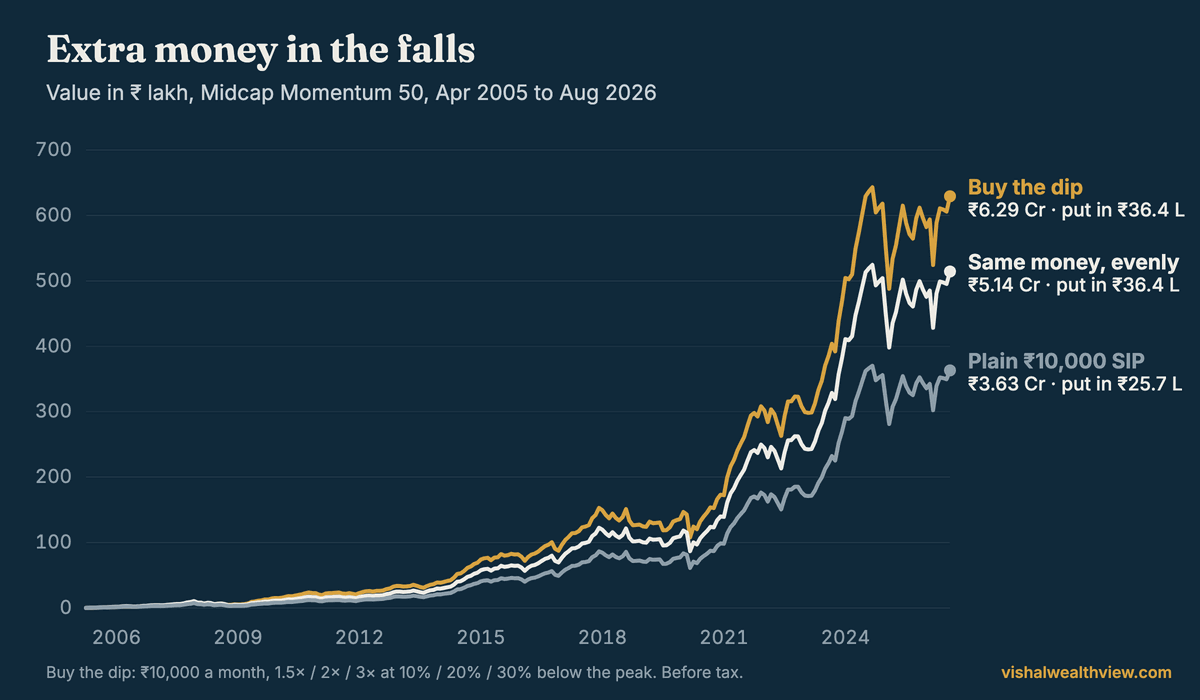
The catch: dips can last years
The extra money has to be ready for as long as the fall lasts. Midcap Momentum 50 stayed 10% or more below its peak for 57 months in a row, until September 2012. The Nifty 50 did so for 42 months to September 2003, and the S&P 500 for 68 months to September 2006. Across the whole history, the index was at least 10% below its peak in 38% of Nifty 50 months, 40% of Midcap Momentum 50 months and 33% of S&P 500 months. Anyone following the rule needed spare cash through all of that, not for a few weeks.
For a single-index deep dive with a simpler trigger (double the SIP at a 12% fall), see our Nifty 50 buy-the-dip backtest.
What to take from this
Of the strategies we tested, this is the one that most often helped: a small gain per rupee in almost every period, and a large one on the Indian indices when compared with the same money spread evenly. It needs money that is genuinely spare, a plain SIP that never stops, and patience through dips that last years. It is still past data on three indices, not a promise.
The buy-the-dip SIP type is part of Strategy Lab Premium. The plain SIP, the drawdown rule and the strategy search are free.
Investing in the US? The DCA backtest is the same Lab in dollar-cost-averaging terms, on the S&P 500 in dollars.
Questions people ask
What is a buy-the-dip SIP?
A SIP that keeps investing every month and adds extra money when the index is below its peak, for example 1.5 times the SIP at a 10% fall, 2 times at 20% and 3 times at 30%. It never sells.
Does buying the dip beat a regular SIP?
Per rupee, slightly and almost always: it beat a plain SIP in 243 of 251 ten-year periods on the Nifty 50 and 136 of 138 on Midcap Momentum 50, by under half a point a year. Against the same total money spread evenly, it grew 23.4% more on the Nifty 50 and 22.3% more on Midcap Momentum 50 since 2005, but 2.2% less on the S&P 500.
How much extra cash does a buy-the-dip SIP need?
Up to three times the SIP in a deep fall, for as long as the fall lasts. Midcap Momentum 50 stayed 10% or more below its peak for 57 months in a row; the Nifty 50 for 42 months to September 2003.
Is buy the dip the same as a drawdown rule?
No. A buy-the-dip SIP only adds money and never sells. A drawdown rule sells part of the holding after a fall and buys it back later.
Data: official month-end closes from NSE Indices for the Nifty 50 (Nov 1995 to Aug 2026) and Nifty Midcap150 Momentum 50 (Apr 2005 to Aug 2026); S&P 500 month-end closes from Yahoo Finance (Jan 1985 to Aug 2026). All are price indices, so dividends are left out of both sides. A fixed monthly amount is invested at each month-end. Money moved out earns 6% a year in a liquid fund in India and 4% in cash for the S&P 500. Returns are money-weighted (XIRR) and before tax unless a line says otherwise; the after-tax runs use the Strategy Lab’s Indian rules (12.5% long-term and 20% short-term gains, ₹1.25 lakh exemption, liquid-fund interest at a 30% slab) and, for the S&P 500, US rules (15% long-term, 24% short-term). Rolling periods start in every month. Figures come from the same engine the Strategy Lab runs in your browser. The dip SIP invests 1.5× the SIP in a month the index ends more than 10% below its highest month-end so far, 2× beyond 20% and 3× beyond 30%. “Same money evenly” is a plain SIP sized so its total equals the dip SIP’s total. S&P 500 amounts are for a $1,000 monthly SIP. Past returns are not a promise of future returns. Nothing here is a recommendation to buy or sell anything. See the disclaimer.
← All strategies