

Value averaging vs SIP: more return per rupee, far fewer rupees
Value averaging sets a target for what your portfolio should be worth each month, and invests whatever it takes to reach it. When the market has fallen, you put in more; when it has risen past the target, you put in less or nothing. Michael Edleson introduced it in 1988. In India it is sold as a value-averaging investment plan (VIP). A SIP fixes the amount you invest; value averaging fixes the path your portfolio should follow.
How it works
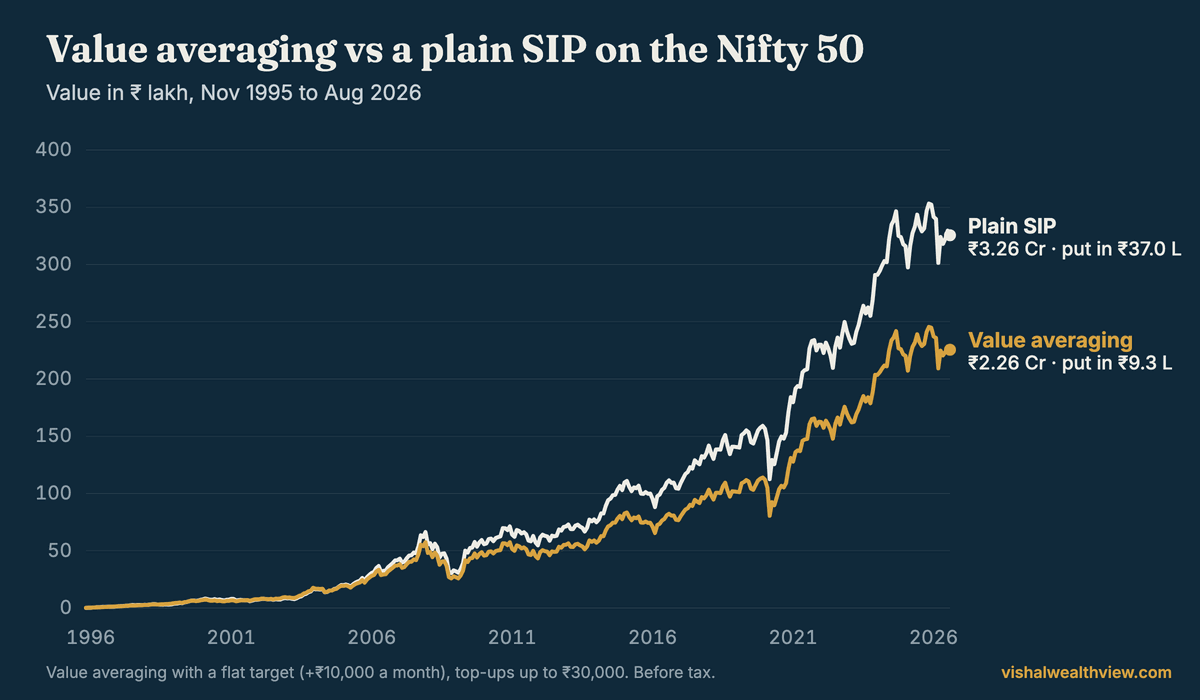
In the version we tested, the target rises by ₹10,000 every month. If the portfolio is ₹4,000 short of the target, you invest ₹4,000; if it is ₹25,000 short after a fall, you invest ₹25,000, up to a cap of three times the SIP (₹30,000). If it is ahead of the target, you skip the month. It never sells, which is how most Indian VIPs work too.
The result on three markets
| Whole history | Plain SIP | Value averaging | Put in (VA vs SIP) | Months skipped |
|---|---|---|---|---|
| Nifty 50, 1995–2026 | 11.83% | 12.54% | ₹9.3 L vs ₹37.0 L | 323 of 370 |
| Midcap Momentum 50, 2005–2026 | 20.97% | 21.83% | ₹5.4 L vs ₹25.7 L | 228 of 257 |
| S&P 500, 1985–2026 | 9.07% | 9.41% | $104k vs $500k | 437 of 500 |
Per rupee, value averaging won everywhere: a higher return than a SIP in all 251 ten-year periods on the Nifty 50, 129 of 138 on Midcap Momentum 50 and 330 of 381 on the S&P 500. It buys more when prices are low by design.
But look at how little it invested. With a target that rises by a flat amount, a market that grows 12% a year keeps the portfolio ahead of target, and value averaging stops asking for money. On the Nifty 50 it put in ₹9.3 lakh over 30 years against a SIP’s ₹37 lakh, and ended with ₹2.26 crore against ₹3.26 crore. A higher return on a quarter of the money is a smaller pot.
A target that grows
The textbook fix is a target that grows with the return you expect. Raising the monthly target increase by 12% a year, value averaging on the Nifty 50 made 12.68%, put in ₹17.1 lakh and ended with ₹3.38 crore, still skipping 301 of 370 months. On the S&P 500, with the target growing 10% a year, it made 9.61% and put in $971k against a SIP’s $500k, hitting its three-times cap in 306 months. Set the growth too high and value averaging turns into a much bigger SIP; set it too low and it barely invests.
What to take from this
Value averaging is a good rule for how much to invest in a given month, and it reliably earns more per rupee. It is a poor rule for building a corpus on its own, because in a rising market the money it does not ask for has to go somewhere else. Pair it with a plan for the skipped months, or use a buy-the-dip SIP, which keeps the base SIP going and only adds in falls.
Value averaging is part of Strategy Lab Premium. The plain SIP, the drawdown rule and the strategy search are free.
Investing in the US? The DCA backtest is the same Lab in dollar-cost-averaging terms, on the S&P 500 in dollars.
Questions people ask
What is value averaging?
An investing method in which you set a target value for your portfolio each month and invest whatever it takes to reach it: more after a fall, less or nothing after a rise. Michael Edleson introduced it in 1988.
Is value averaging better than a SIP?
Per rupee, yes in our backtest: it earned more than a SIP in all 251 ten-year periods on the Nifty 50. But with a flat target it invested far less, ₹9.3 lakh against ₹37 lakh over 30 years, and ended with a smaller corpus, ₹2.26 crore against ₹3.26 crore.
Why does value averaging invest so little?
When the market grows faster than the target, the portfolio stays ahead of it and the rule skips the month. On the Nifty 50 it skipped 323 of 370 months with a target rising ₹10,000 a month. A target that grows each year fixes part of this.
What is a VIP in mutual funds?
A value-averaging investment plan: a SIP whose monthly amount changes with the market, investing more when your holding is below target and less when it is above. Most VIPs never sell.
Data: official month-end closes from NSE Indices for the Nifty 50 (Nov 1995 to Aug 2026) and Nifty Midcap150 Momentum 50 (Apr 2005 to Aug 2026); S&P 500 month-end closes from Yahoo Finance (Jan 1985 to Aug 2026). All are price indices, so dividends are left out of both sides. A fixed monthly amount is invested at each month-end. Money moved out earns 6% a year in a liquid fund in India and 4% in cash for the S&P 500. Returns are money-weighted (XIRR) and before tax unless a line says otherwise; the after-tax runs use the Strategy Lab’s Indian rules (12.5% long-term and 20% short-term gains, ₹1.25 lakh exemption, liquid-fund interest at a 30% slab) and, for the S&P 500, US rules (15% long-term, 24% short-term). Rolling periods start in every month. Figures come from the same engine the Strategy Lab runs in your browser. Value averaging: the target rises by the SIP each month (or by an amount growing at the stated rate a year), each month invests the shortfall up to 3× the SIP, and months above target invest nothing. It never sells. S&P 500 amounts are for a $1,000 monthly SIP. Past returns are not a promise of future returns. Nothing here is a recommendation to buy or sell anything. See the disclaimer.
← All strategies